
Introduction:
Everything written here is subject to probability. Since we are not closed to any of the big money forces that drive the market, and since no one can predict the future, we can only watch carefully the footsteps of the big forces by the prices and the volume and to estimate directions and targets wherever possible (sometimes it is not possible at all and we need to wait patiently for another clue in the puzzle)
DAX (Futures):
Long term:
By the Semiannual, we can see that the market currently stopped at the A-B 2000-2002 bearish market 161.8% extension at 11812 while the previous semiannual bar has tested it again accurately.
This level is also very close by this scale to the B-C-D 2003-2007 Bullish market and 2008-2009 bearish market 138.2% Projection at 11972.
Currently the most important level to watch long term is the Semiannual LLBH( Last Low Before High) at 8350.
Taking this level out would probably continue this decline to the long term support at 7270. By this semiannual scale it might include a Monthly pullback within this decline, hence can be a very misleading move.
On any signs of strength, pay attention to the big open gap above the current semiannual bar. Any thrust to these levels (10522-10729) that reverses on the Monthly timeframe before closing this gap fully can start such a move down.
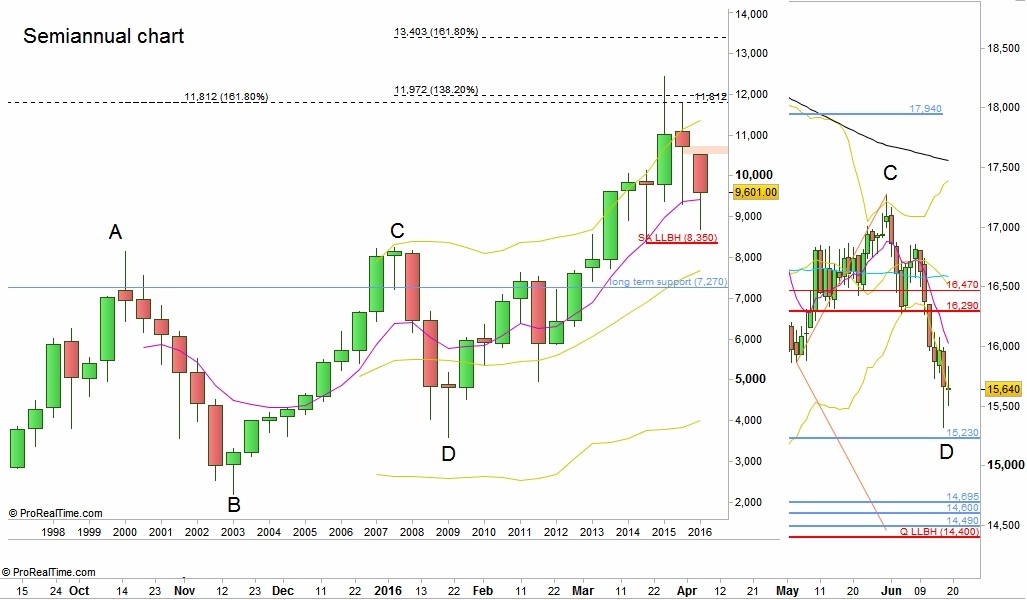
DAX Futures, Semiannual chart (at the courtesy of prorealtime.com)
Short term:
By the Daily chart, we see that the wave up from mid February has failed in the follow thru process, hence we’ve got the current bearish wave.
Last Friday, price has taken out the Daily LHBL (Last High Before Low) but closed very weak.
In case the market makes (on Monday, not later) a thrust down below the Daily bar, it is a major sign of weakness for this timeframe. I would wait for another pull back that doesn’t take out the High of Friday in order to go short below the last Low created (sketched).
Target is 9326 (Expect puncturing it at least).
Monthly 50 SMA at 9260 should give some support.
Further signs of weakness can bring the price to test the open gap at the 9000 levels, the Monthly lower Bollinger Band.
On the bullish side, any thrust above Friday’s high should close the open gap from above within the same momentum. I would wait for a reversal after the upper gap is closed.
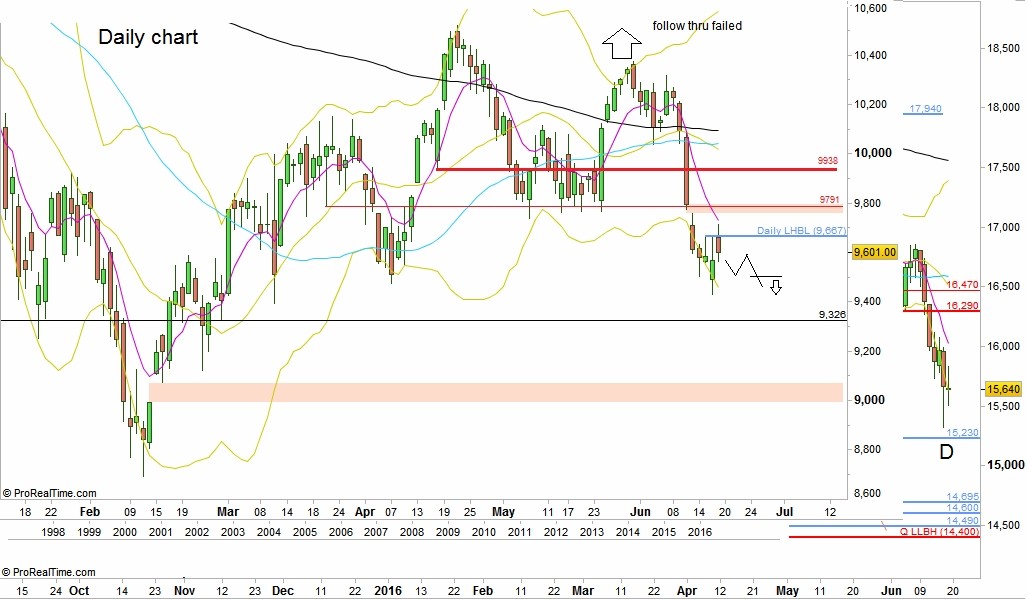
DAX Futures, Daily chart (at the courtesy of prorealtime.com)
Disclaimer :
My opinions are based on price action only, estimating which force (buyers or sellers) is in control at the moment. Markets can change behavior instantly due to new input/estimations/news/events.
Opinions expressed herein are my current opinions as of the date appearing in this material only and are subject to change without notice by further price action of the market. Any of the assumptions used herein do not prove to be true, results are likely to vary substantially. All investments entail risks. There is no guarantee that current price action will achieve the desired results under all market conditions and each investor should evaluate its ability to invest for the timeframe mentioned in the review and to accept the risk involved. No representation is being made that any account, product, or strategy will or is likely to achieve profits, losses, or results similar to those discussed.
I will not have any liability for any damages of any kind whatsoever relating to this material.